Classes are so much more fun when it’s not just a lecture. From the teacher point of view, I think it’s pretty boring to just drone on at students for an hour without a break. And for students, it’s even more boring — trying to concentrate on someone talking at you for hours on end is incredibly difficult. But when there’s interactivity — something to get you out of your seat, a cool demonstration, problems that make you participate — suddenly, the class is far more engaging.
Some of the best fun in my own teaching experiences has come from the interactive activities that I’ve created for students. For the last 2 weeks of my GTL experience, I taught statistics to 4 different classes. These students were in years 3 and 4 of high school, which means that any activities needed to strike a balance between usefulness, non-cheesiness, and actually being engaging. Throughout the different classes, I tried a couple of different interactive segments, and wanted to share how I thought they went!
(This point of view has been slightly shaped by my experiences running teacher orientations for ESP, sharing many tips, including some on interactive techniques. We’ve modified our own handout from the one here.)
Guts Round
Those of you who did math competitions in high school might remember something called a “guts round” – a team-based competition to answer questions quickly. I first tried writing a guts round as a review session for a summer camp 2 years ago and found that it worked amazingly. It’s become my review session activity-of-choice, especially for groups that I have very limited time with.
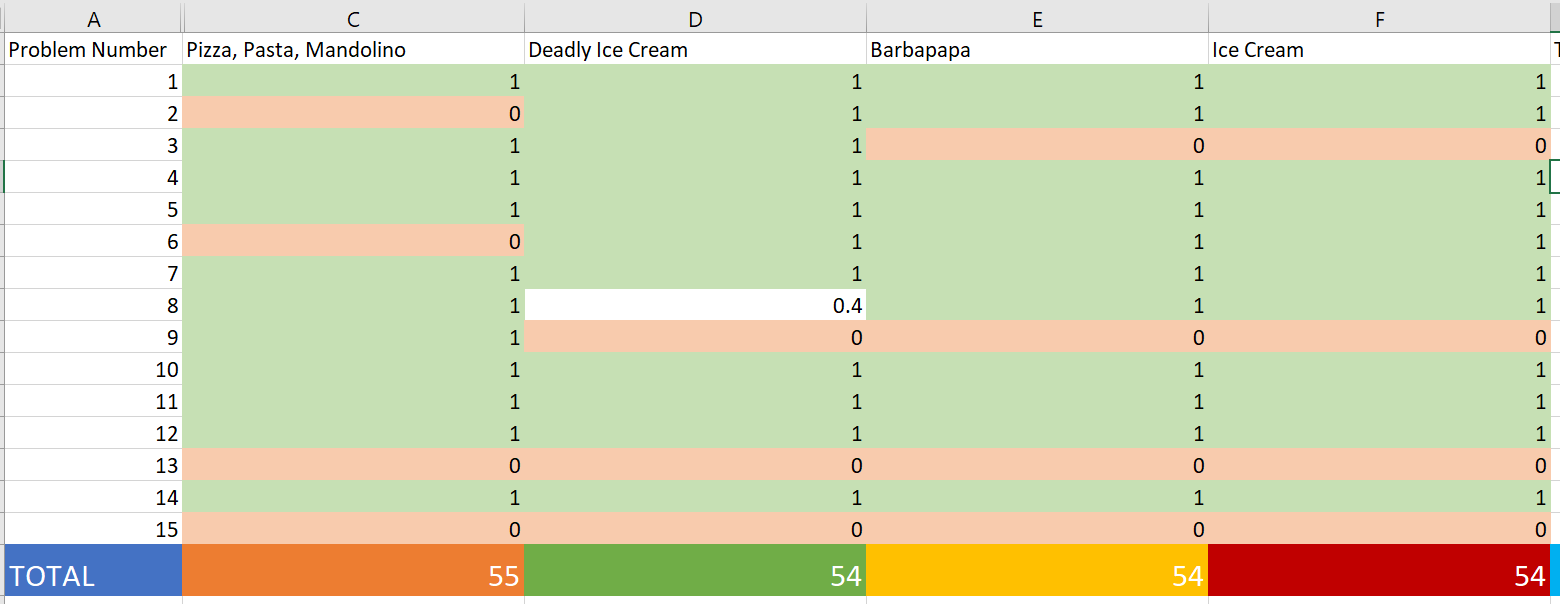
My guts round consists of 15 questions divided into 5 sets of 3 questions. Each team (of 3-4 people) only gets 3 questions at a time, and in order to see the next 3 questions, they have to submit their final answers to the previous 3 questions. Each question has a certain number of points, and the point value (and difficulty) increases as time goes on. As students submit their answers, I grade them in real-time and project the team’s point progress onto the board.
A team that strategizes well will try and speed through the first sets of questions to spend time on the far more difficult later sets that are worth more points. However, going too fast can lead to careless errors, losing out on “easy points”.
From what I’ve seen, guts rounds are incredibly fun. Students like working together and competing against each other to be the best team. But they’re also invaluable learning tools.
- Students get to work with each other, and so have a chance to learn from each other. For most questions, at least one person on the team knows how to do the problem. Team sizes are also small enough that everyone works together on every problem, meaning that the knowledge gets shared with everyone.
- The difficulty gradient allows students to directly review of problems that they’ve seen before and also see questions that they haven’t seen, pushing their knowledge even further.
- The live grading lets me see if there are any questions that most groups are having trouble on, letting me review specific problems and concepts with them.
Of course, they’re not perfect, as teams might be uneven and so the “losers” learn less. As a whole, though, guts rounds are probably my favorite activity to run.
Height and Standard Deviation

I was at the end of my lecture on measures of variation – range, variance, and standard deviation – and managed to run out of content with 20 minutes left. To fill the rest of the time, I decided that I wanted to show them why we care about standard deviation as a measure using a live demonstration of the standard deviation and the normal distribution!
I had each student tell me their height in centimeters. I wrote them all out on the board and used my computer to calculate the mean and standard deviation. Then, calculating the mean plus or minus one standard deviation, we found that 11/16, or 68.75% of students, were within that range. Supposing that human height is normally distributed, statistics predicts that 68.3% of people should be within this range – very, very close to what we found!
The point of this demonstration is to show that the standard deviation has interesting properties that relate to how far away numbers are from the mean. The definition of standard deviation seems pretty arbitrary, especially when you see the content for the first time. Why are you squaring things? Why the square root? Why not just the variance?
But when students see the most useful property of standard deviation, its relevance to the normal curve, even if the definition isn’t completely clear yet, they see why it is used.
The activity also led to lots of fantastic questions from students. Why 68.3%? What does “normal” mean? How far away from 68.3% can it be? The fact that these questions get asked means two things: first, students actually understood the activity; second, that it was an interesting enough activity to pique their curiosity.
In hindsight, one thing I should have done was predict 68.3% before getting their results. I had never done this activity, so wasn’t sure how well it would work. But for the future, I now know to put faith in height being normal.
Mental Math
I really like mental math – squaring and multiplying numbers in my head, calculating days of the week across any year, and more. The actual math content of mental math is not difficult, as it’s simply learning the tricks to keep numbers organized in your head. With lots of practice, the math becomes second nature, and it can seem like “mathemagic”.
Students in years 3 and 4 are already immensely familiar with algebra and variables – but the jump from arithmetic to algebra often leaves people wondering about the connection back to reality. Mental math lets me do that in a very “practical” way.
One example is with squaring numbers, and the difference of squares. Students have had this factoring ingrained into them: 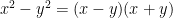
Calculating 

Adding 25 to both sides, we can then find that 

The trick works any square ending in 5 – for 2 digit numbers, it’s as simple as taking the tens digit, multiplying it by one more than itself, and then sticking “25” at the end of that number. With some more explaining on the board and a few extra examples, I can get students to do 
Throughout GTL, I did a few examples of mental math during my introductions to showcase things I do for fun. (Wow, what a nerd, Paolo.) My main goal in demonstrating mental math to them was so I could promise them to teach the tricks to them later in the week, I think I also earned a little respect by doing math faster than they could type it into their calculators 😛
Exercise Pairing

This isn’t so much an “activity” that I did, but instead a small technique I used in lessons to make it less boring. I get tired of lecturing, and students get tired of listening. Oftentimes, when I had an example that I wanted to work through, I used a technique that I love telling people about during ESP Teacher Orientations – Think-Pair-Share (#100 on the link above!).
I’d write the problem on the board, then let students copy it down, try to understand it, and think about how they’d solve it by themselves for a little bit. After a minute or so, I’d have them talk to their neighbors about their different approaches, then work together to find a solution. When it seemed that most people had worked through it, I brought everyone back together to talk about the different ways that they got to the answer.
Think-Pair-Share is fantastic for breaking up the monotony of lectures without having to plan out an entire activity. I just need to prepare different exercises, and students get the chance to work through problems individually and collaborating.
I know for a fact that I’m still not a perfect teacher. I made mistakes in explaining content, bored students occasionally, and used inefficient or ineffective ways of explaining material. There are always things to improve, and so here’s to improving during future ESP programs and maybe future GTLs 🙂
Much like Sarah, this post was truly a “Splash on Planes” for me – sitting in JFK waiting for my flight to BOS. I’ve got a few final thoughts on everything that I learned during GTL, teaching and otherwise (mostly the latter), that I’m very excited to share in my last Splash on Planes blog post.
